What Follower Counts Really Measure: Reach, Overlap and Estimates
Why platform totals are not unique people, why animated counters are not live observations, and how to read a popularity ranking.
A large follower count is an appealing shortcut for influence. It is visible, easy to rank and simple to understand at a glance. But adding numbers from several platforms creates a measurement problem: the units look alike while the populations behind them overlap. A person who follows the same performer on three services may appear three times in the total.
This guide explains how to interpret a cross-platform follower tracker. The worked examples are invented and do not describe any celebrity's actual audience. The goal is to make the difference between an account total, a unique audience and an estimate clear enough that readers can judge a ranking's claims for themselves.
Define the unit before adding anything
A follower count measures a platform-defined relationship between accounts. A subscriber count may serve a similar visible purpose, but the platform's rules, rounding and update schedule can differ. Neither automatically measures active viewers, paying customers or people who saw a particular post. Label the unit with the platform instead of treating every number as interchangeable attention.
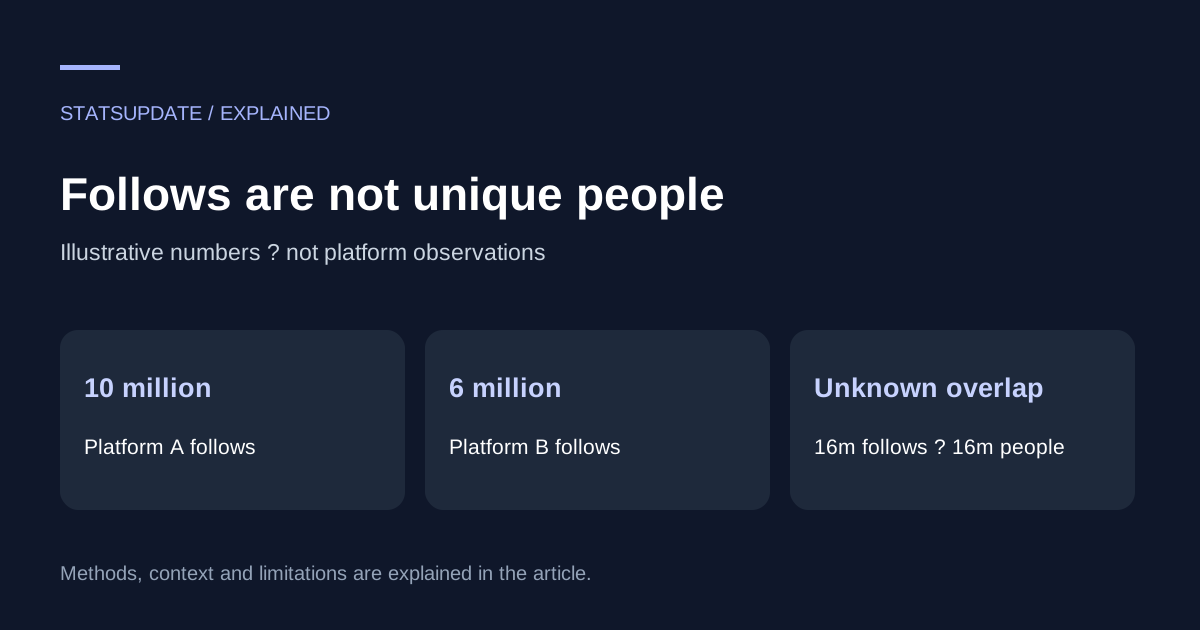
Suppose an entertainer has 10 million followers on Platform A and six million on Platform B. The sum is 16 million account follows. It is not automatically 16 million people. That wording matters: an accurate label can preserve a useful statistic without pretending that the statistic answers a larger question than the available data allows.
Overlap changes the audience estimate
If every follower on B also follows the entertainer on A, the combined set contains 10 million accounts across the two platform populations under this simplified example. If the populations are completely separate, the sum reaches 16 million. Without information about overlap, the total alone cannot locate the answer between those extremes. With real platforms, multiple accounts per person complicate the interpretation further.
These bounds are a teaching device, not a method for estimating unique human reach. The assumptions would need to include how accounts map to people, how inactive accounts are handled and whether the measurement dates align. A responsible presentation reports the observable sum and describes the unobserved overlap instead of inventing a precise deduplicated audience.
A counter can move without a new observation
An animated number may interpolate between two known values or project forward using an assumed growth rate. That can make a display easier to follow, but the animation itself is not evidence of a fresh platform response. A timer that updates every second describes the interface's refresh behavior. It does not establish that the underlying provider measures or publishes a new count every second.
Readers should look for three distinct timestamps: when the platform value was observed, when the dataset was updated and when the interface rendered. A tracker that labels all three simply as “live” hides an important distinction. If only the display refreshes, call it an estimate or animation and show the last verified observation separately.
Rounding can create false precision
A public profile might display a rounded value while an interface presents a long integer. Expanding a rounded source into extra digits does not recover the missing information. For example, a display of 2.4 million does not tell a reader whether the exact count is 2,400,001 or some other nearby value under the platform's rounding convention.
Use a precision level that the source supports. If a comparison depends on a difference smaller than the rounding interval, the order may be uncertain. A ranking can show a tie, an approximate band or a note that the displayed figures cannot resolve the difference. These choices are more informative than a confidently ordered list built from artificial precision.
Growth needs a consistent time interval
Absolute growth is the later count minus the earlier count. Percentage growth divides that change by the earlier count. In an invented example, an account rising from one million to 1.1 million adds 100,000 follows and grows by ten percent. An account rising from ten million to 10.2 million adds twice as many follows but grows by two percent.
Neither measure is a substitute for the other. Absolute growth describes scale; percentage growth describes change relative to a starting point. State whether the interval is a day, a month or a year. Comparing a seven-day change for one account with a thirty-day change for another can reverse the apparent story without any change in the underlying behavior.
Engagement denominators need labels too
An engagement rate can use followers, impressions, reach or views as its denominator. The numerator may include different combinations of likes, comments, shares or saves. Two percentages with different definitions should not appear in a comparison table as if they measured the same thing. A rate needs a formula as well as a value.
Consider an invented post with 1,000 recorded interactions. Dividing by 100,000 followers yields one percent. Dividing by 20,000 impressions yields five percent. The post has not changed; the question has. Before drawing conclusions about community strength, verify which actions are counted and which population represents the opportunity to take those actions.
Popularity is not the same as influence
A large account may have a broad audience but little relevance to a particular subject. A smaller specialist account may reach people who are more likely to act on a specific recommendation. Follower totals cannot establish expertise, trustworthiness, persuasion or commercial effectiveness without additional evidence. They are one descriptive feature of an account, not an all-purpose rating of its owner.
The same limitation applies to cultural interpretation. A sudden increase may coincide with a film release, a sporting event or a controversy. Coincidence suggests a question worth investigating; it does not prove a cause. A useful article looks for timing, alternative explanations and supporting reporting before naming the event responsible for the change.
Missing data should stay visible
If one platform is unavailable, replacing its count with zero says something false: that the account has no followers there. Keeping an older count without a timestamp is also misleading. Mark the value as unavailable or stale, and explain whether it is excluded from the total. That gives readers a chance to understand why a position changed.
A ranking should also identify its inclusion rules. Are only personal accounts eligible? Are brands, teams and duplicate language accounts included? Does a performer have multiple official channels? The rules can be reasonable in more than one form, but they need to be applied consistently. Otherwise the table rewards account structure rather than the intended concept of popularity.
How to read a tracker critically
Look for source links, observation dates, platform labels, rounding notes and an explanation of estimates. Then inspect one row manually against its original profile or data source. A mismatch may result from delay or rounding rather than misconduct, but a tracker should explain its method well enough for you to tell which possibility applies.
Use the result for the question it can answer: how large are the reported account totals under these collection rules? For broader judgments, combine it with context from pop-culture articles and clearly sourced reporting. The YouTube Data API's channel documentation illustrates why platform-specific definitions matter; its subscriber statistics have their own visibility and rounding behavior. A useful ranking makes those limits part of the display.